The Cockpit, the dense view
The "all in one" screen with chart, GEX-by-price, sub-charts and the metrics column.
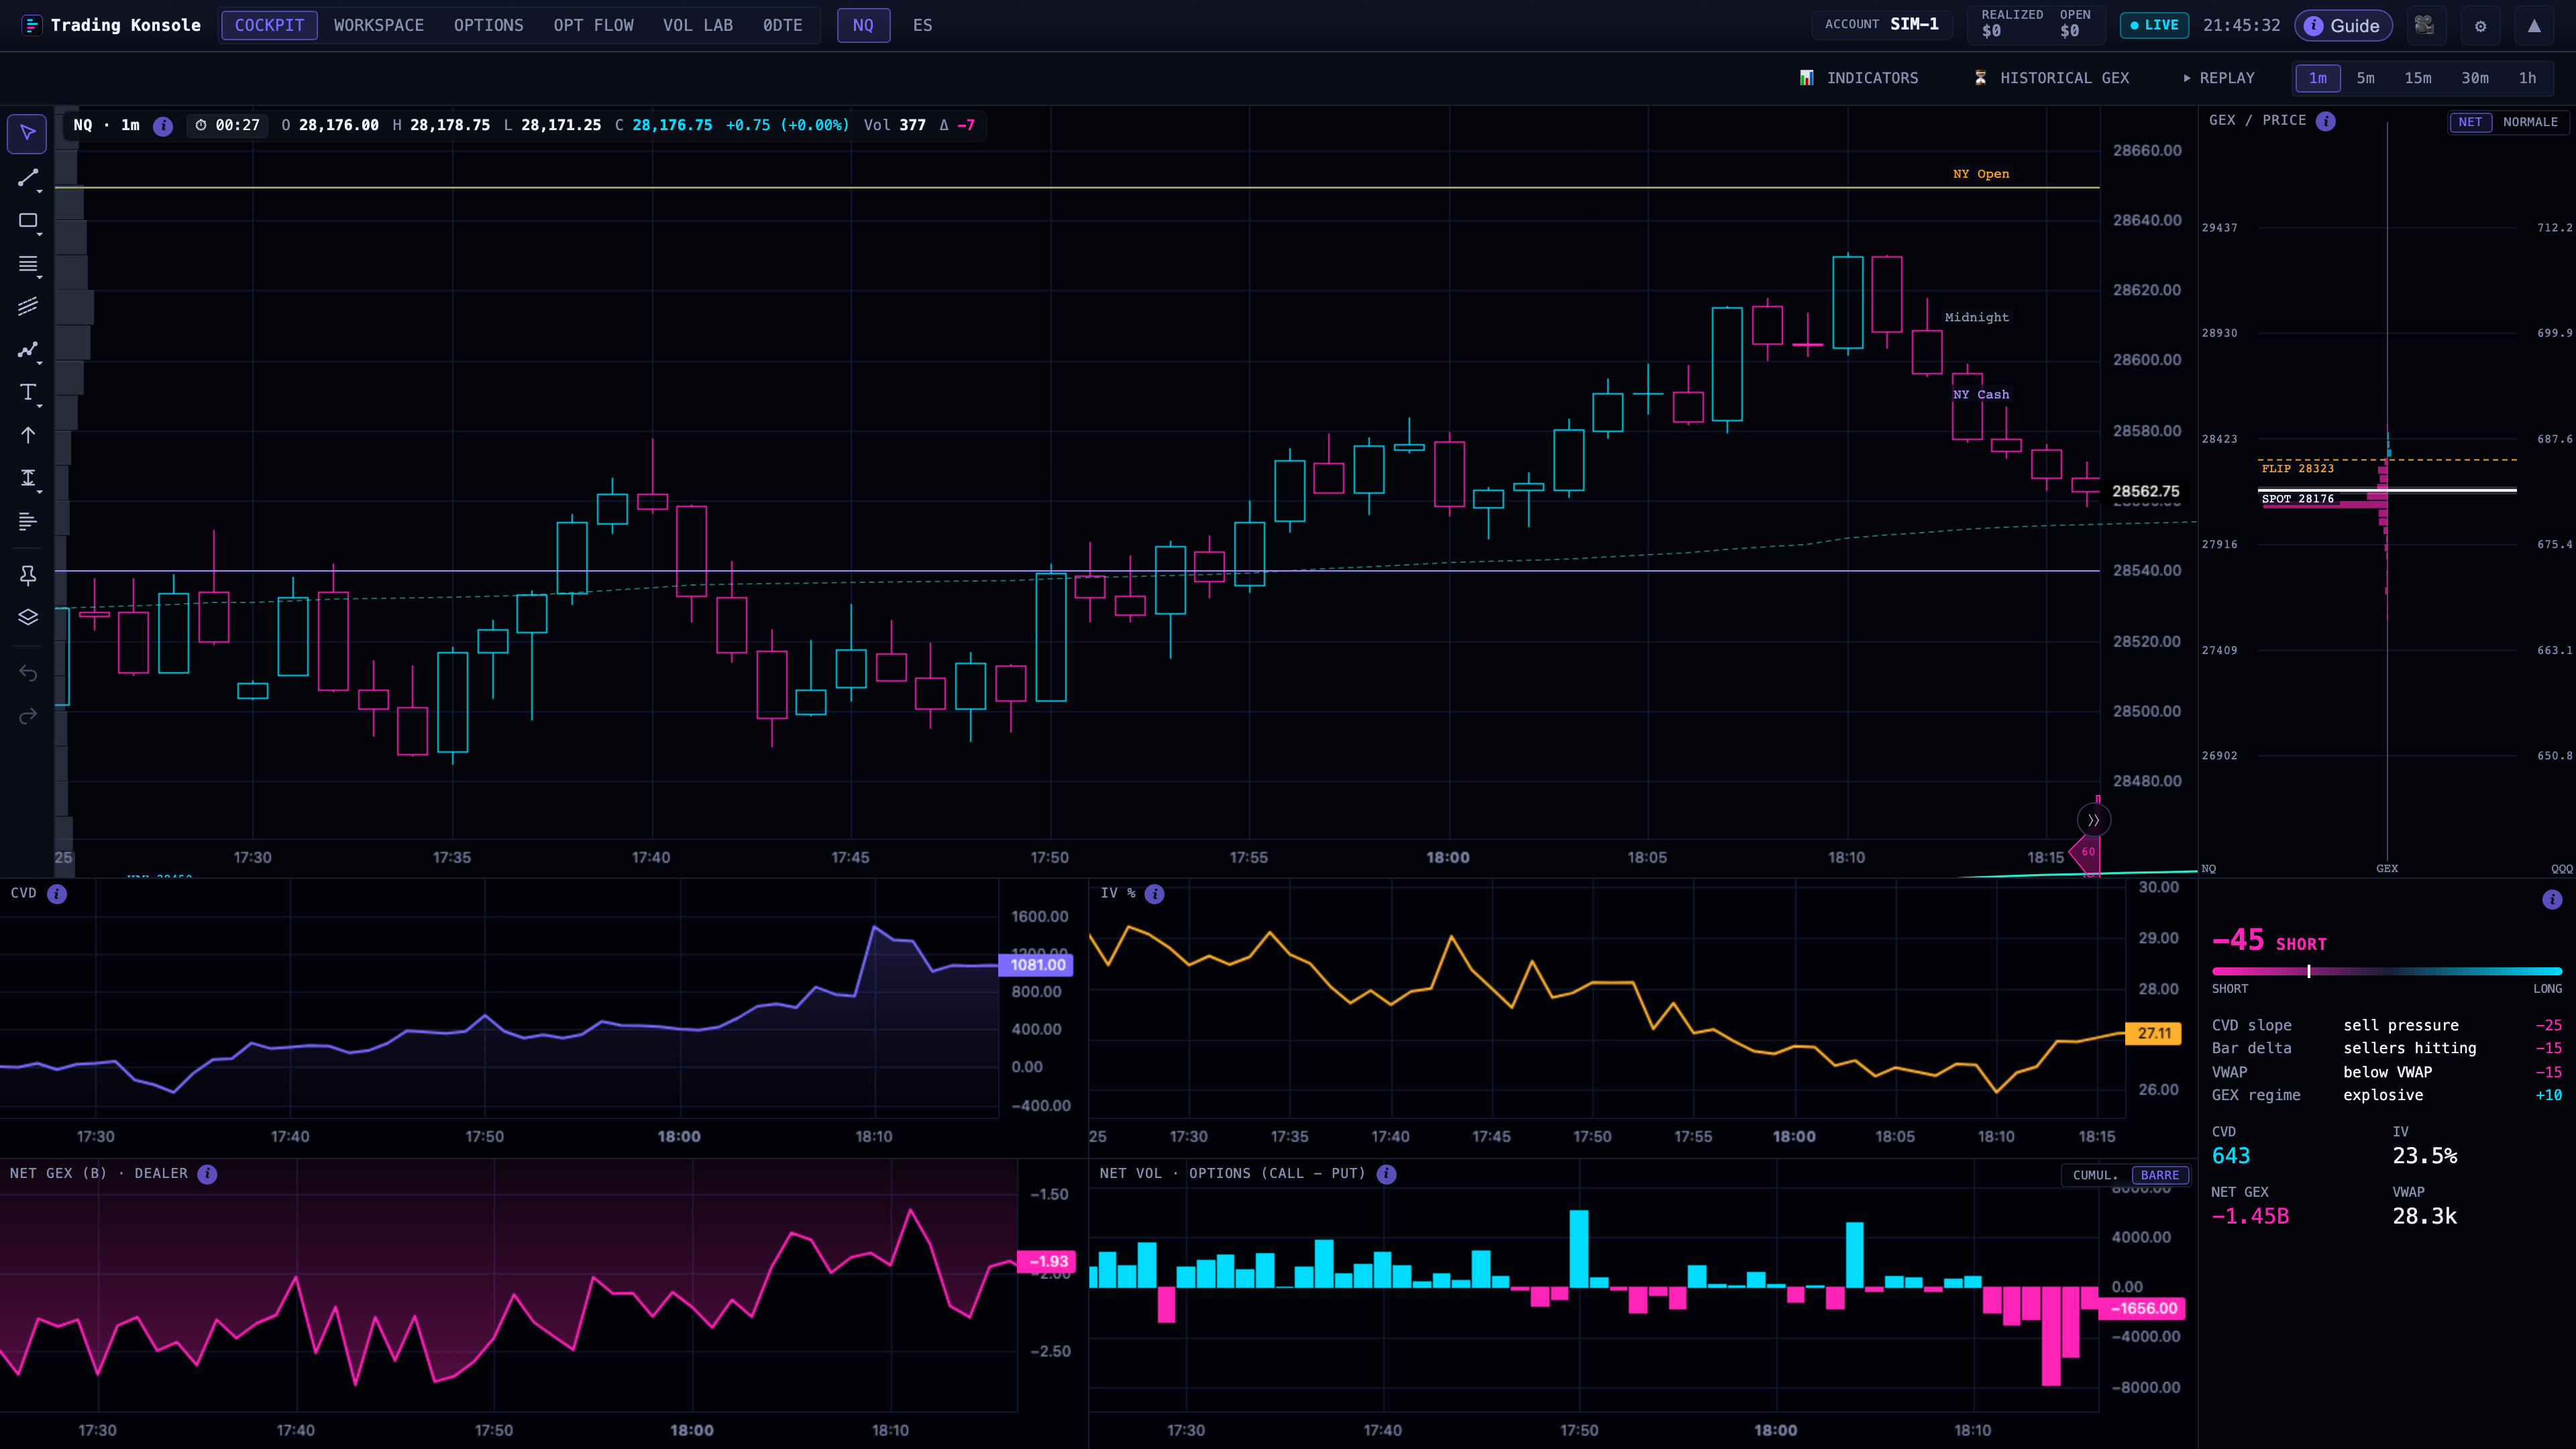
The Cockpit is the “all in one” screen: at a glance it gathers the chart, gamma exposure and the main order-flow and options metrics. It is the right view when you want to keep a lot of information in sight without moving around.
How it is laid out
- Candlestick chart in the centre, synced with the other panels: when you move the time axis or the pointer, everything moves together.
- GEX-by-price panel on the right: gamma exposure per price level, aligned to the chart.
- Sub-charts at the bottom, CVD, IV, Net-GEX, Net-Volume, sharing the crosshair and time axis with the main chart.
- Side column with the summary metrics: Vol Regime, CVD, IV, Net GEX, VWAP and a few options measures.
Picking the instrument
The selector at the top switches between NQ (Nasdaq) and ES (S&P 500). The whole view updates onto the chosen instrument.
Layout presets
The Cockpit can be recalled in ready-made configurations, so you start from a tidy arrangement instead of composing one every time.
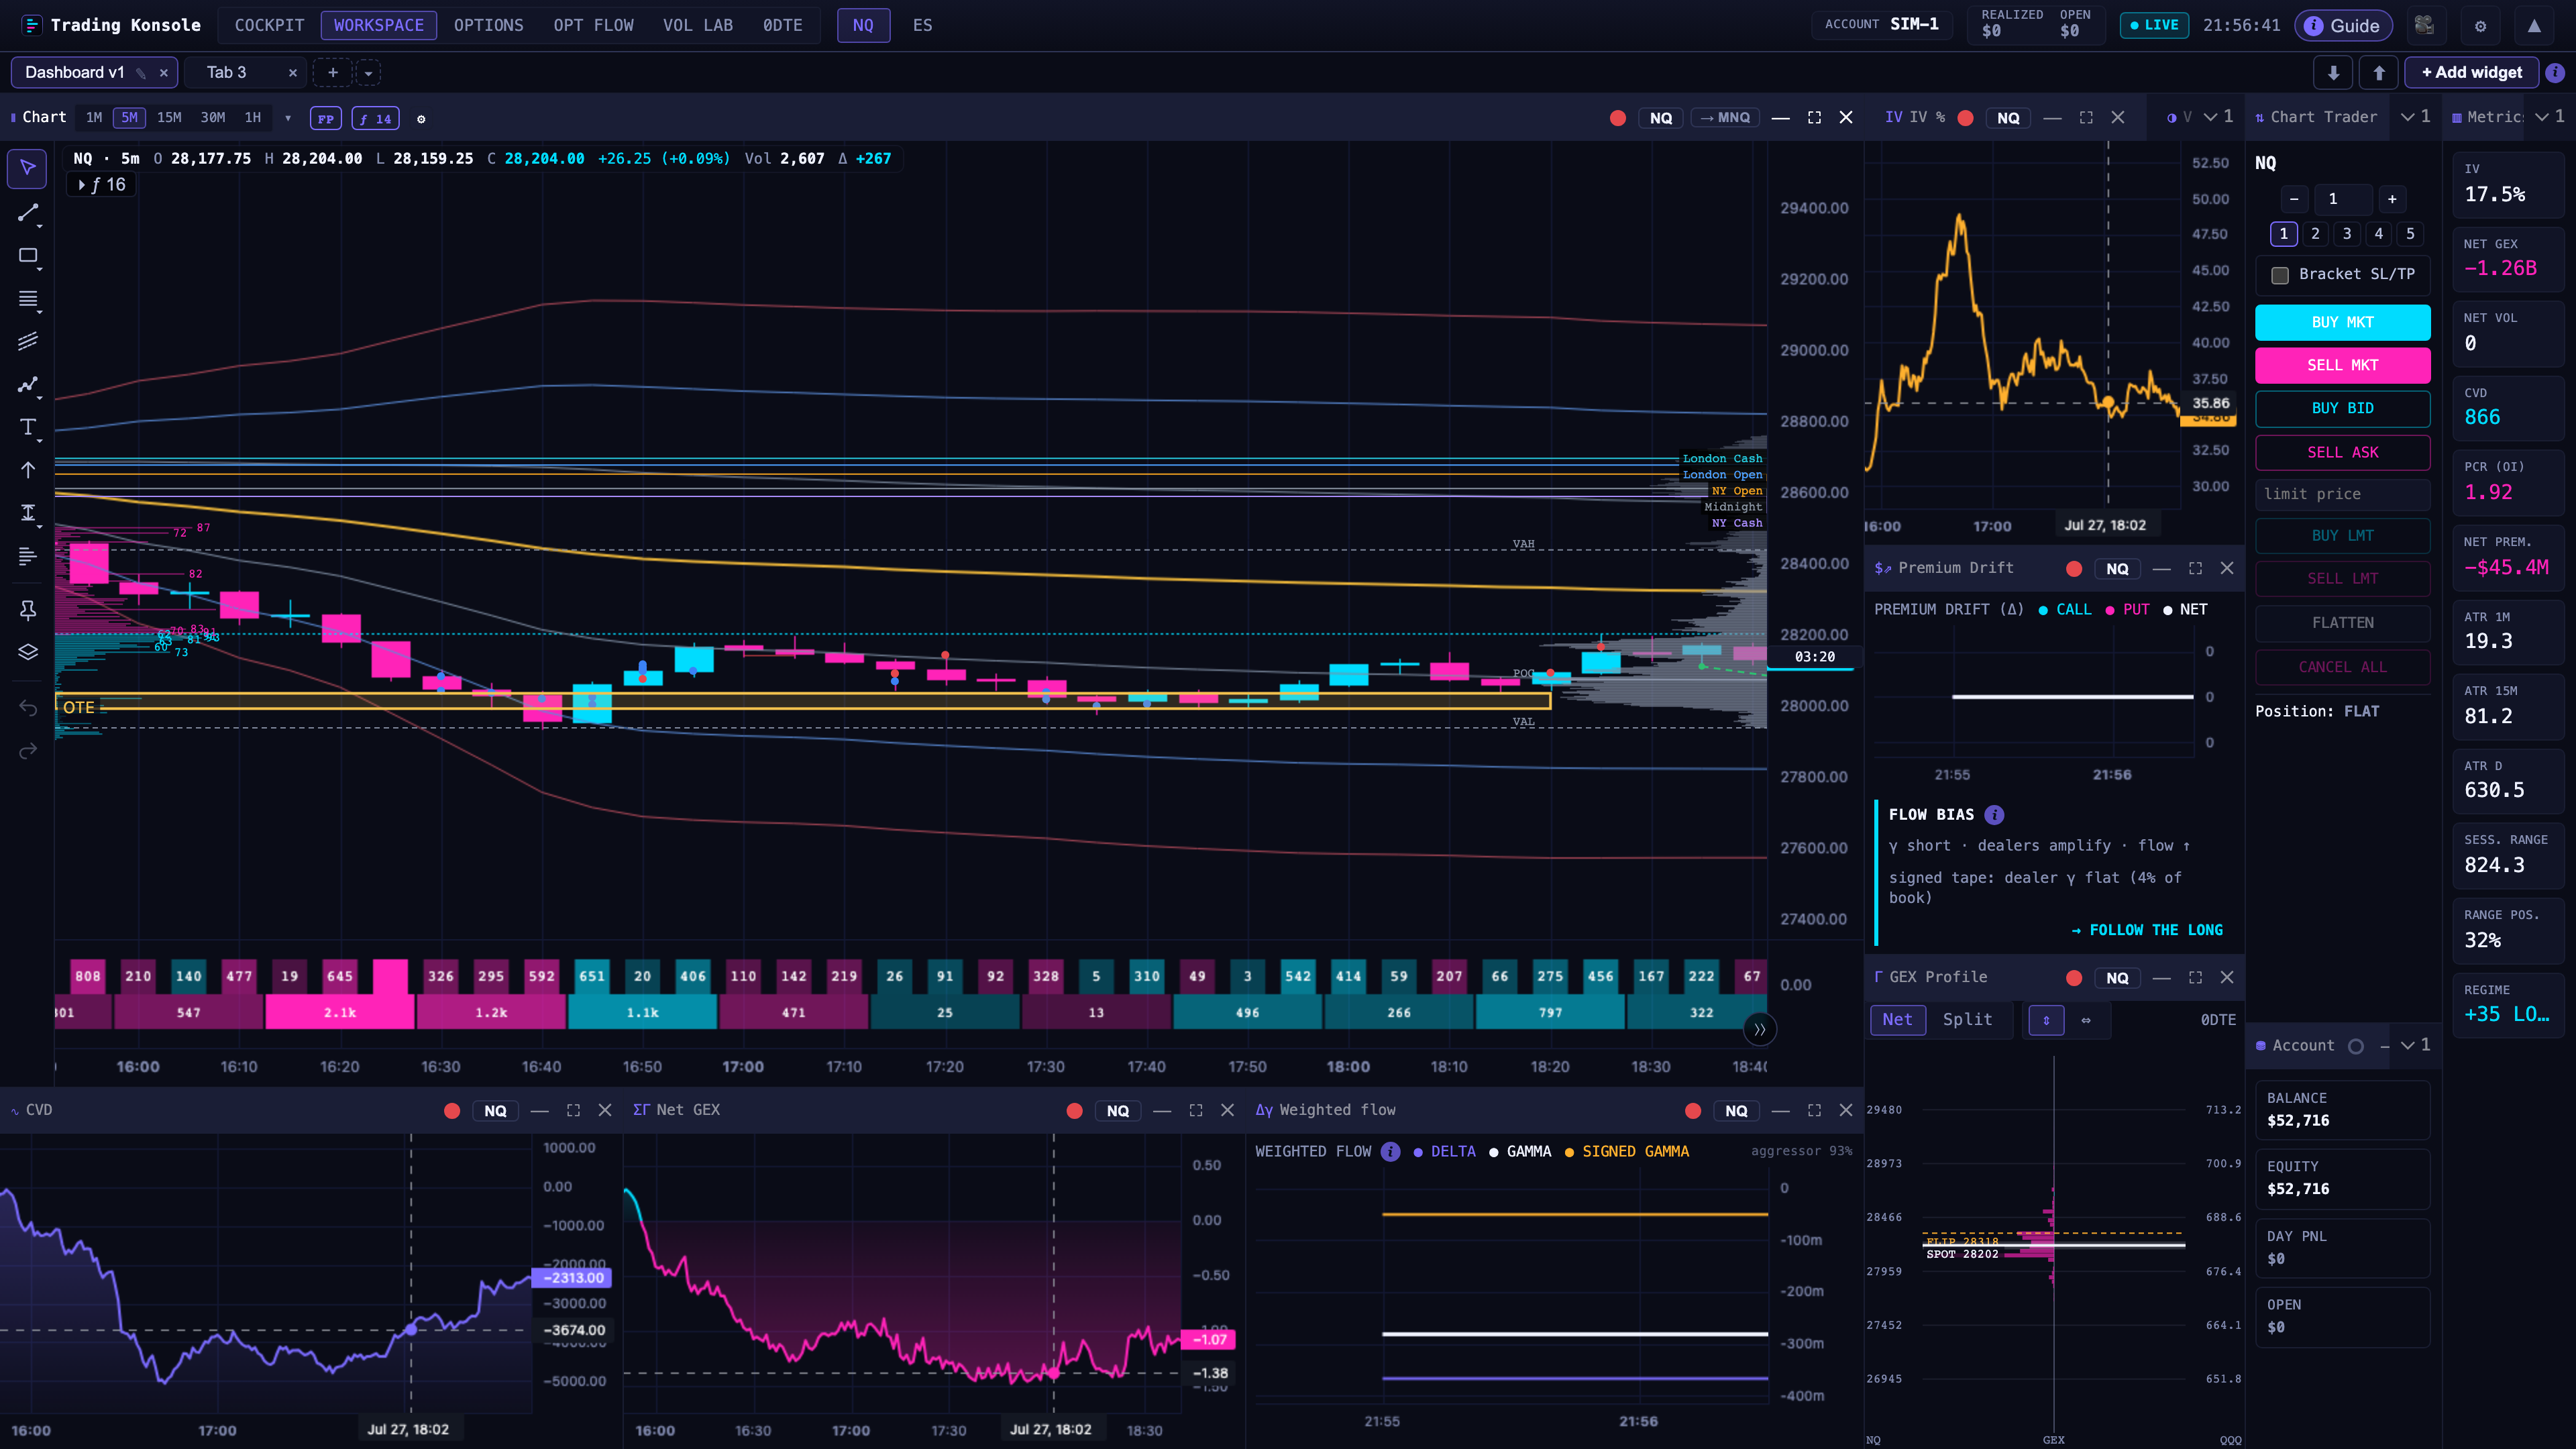
The Cockpit stays as the legacy “all in one” view. New features are built in the composable Workspace, where you can build your own widget arrangement.