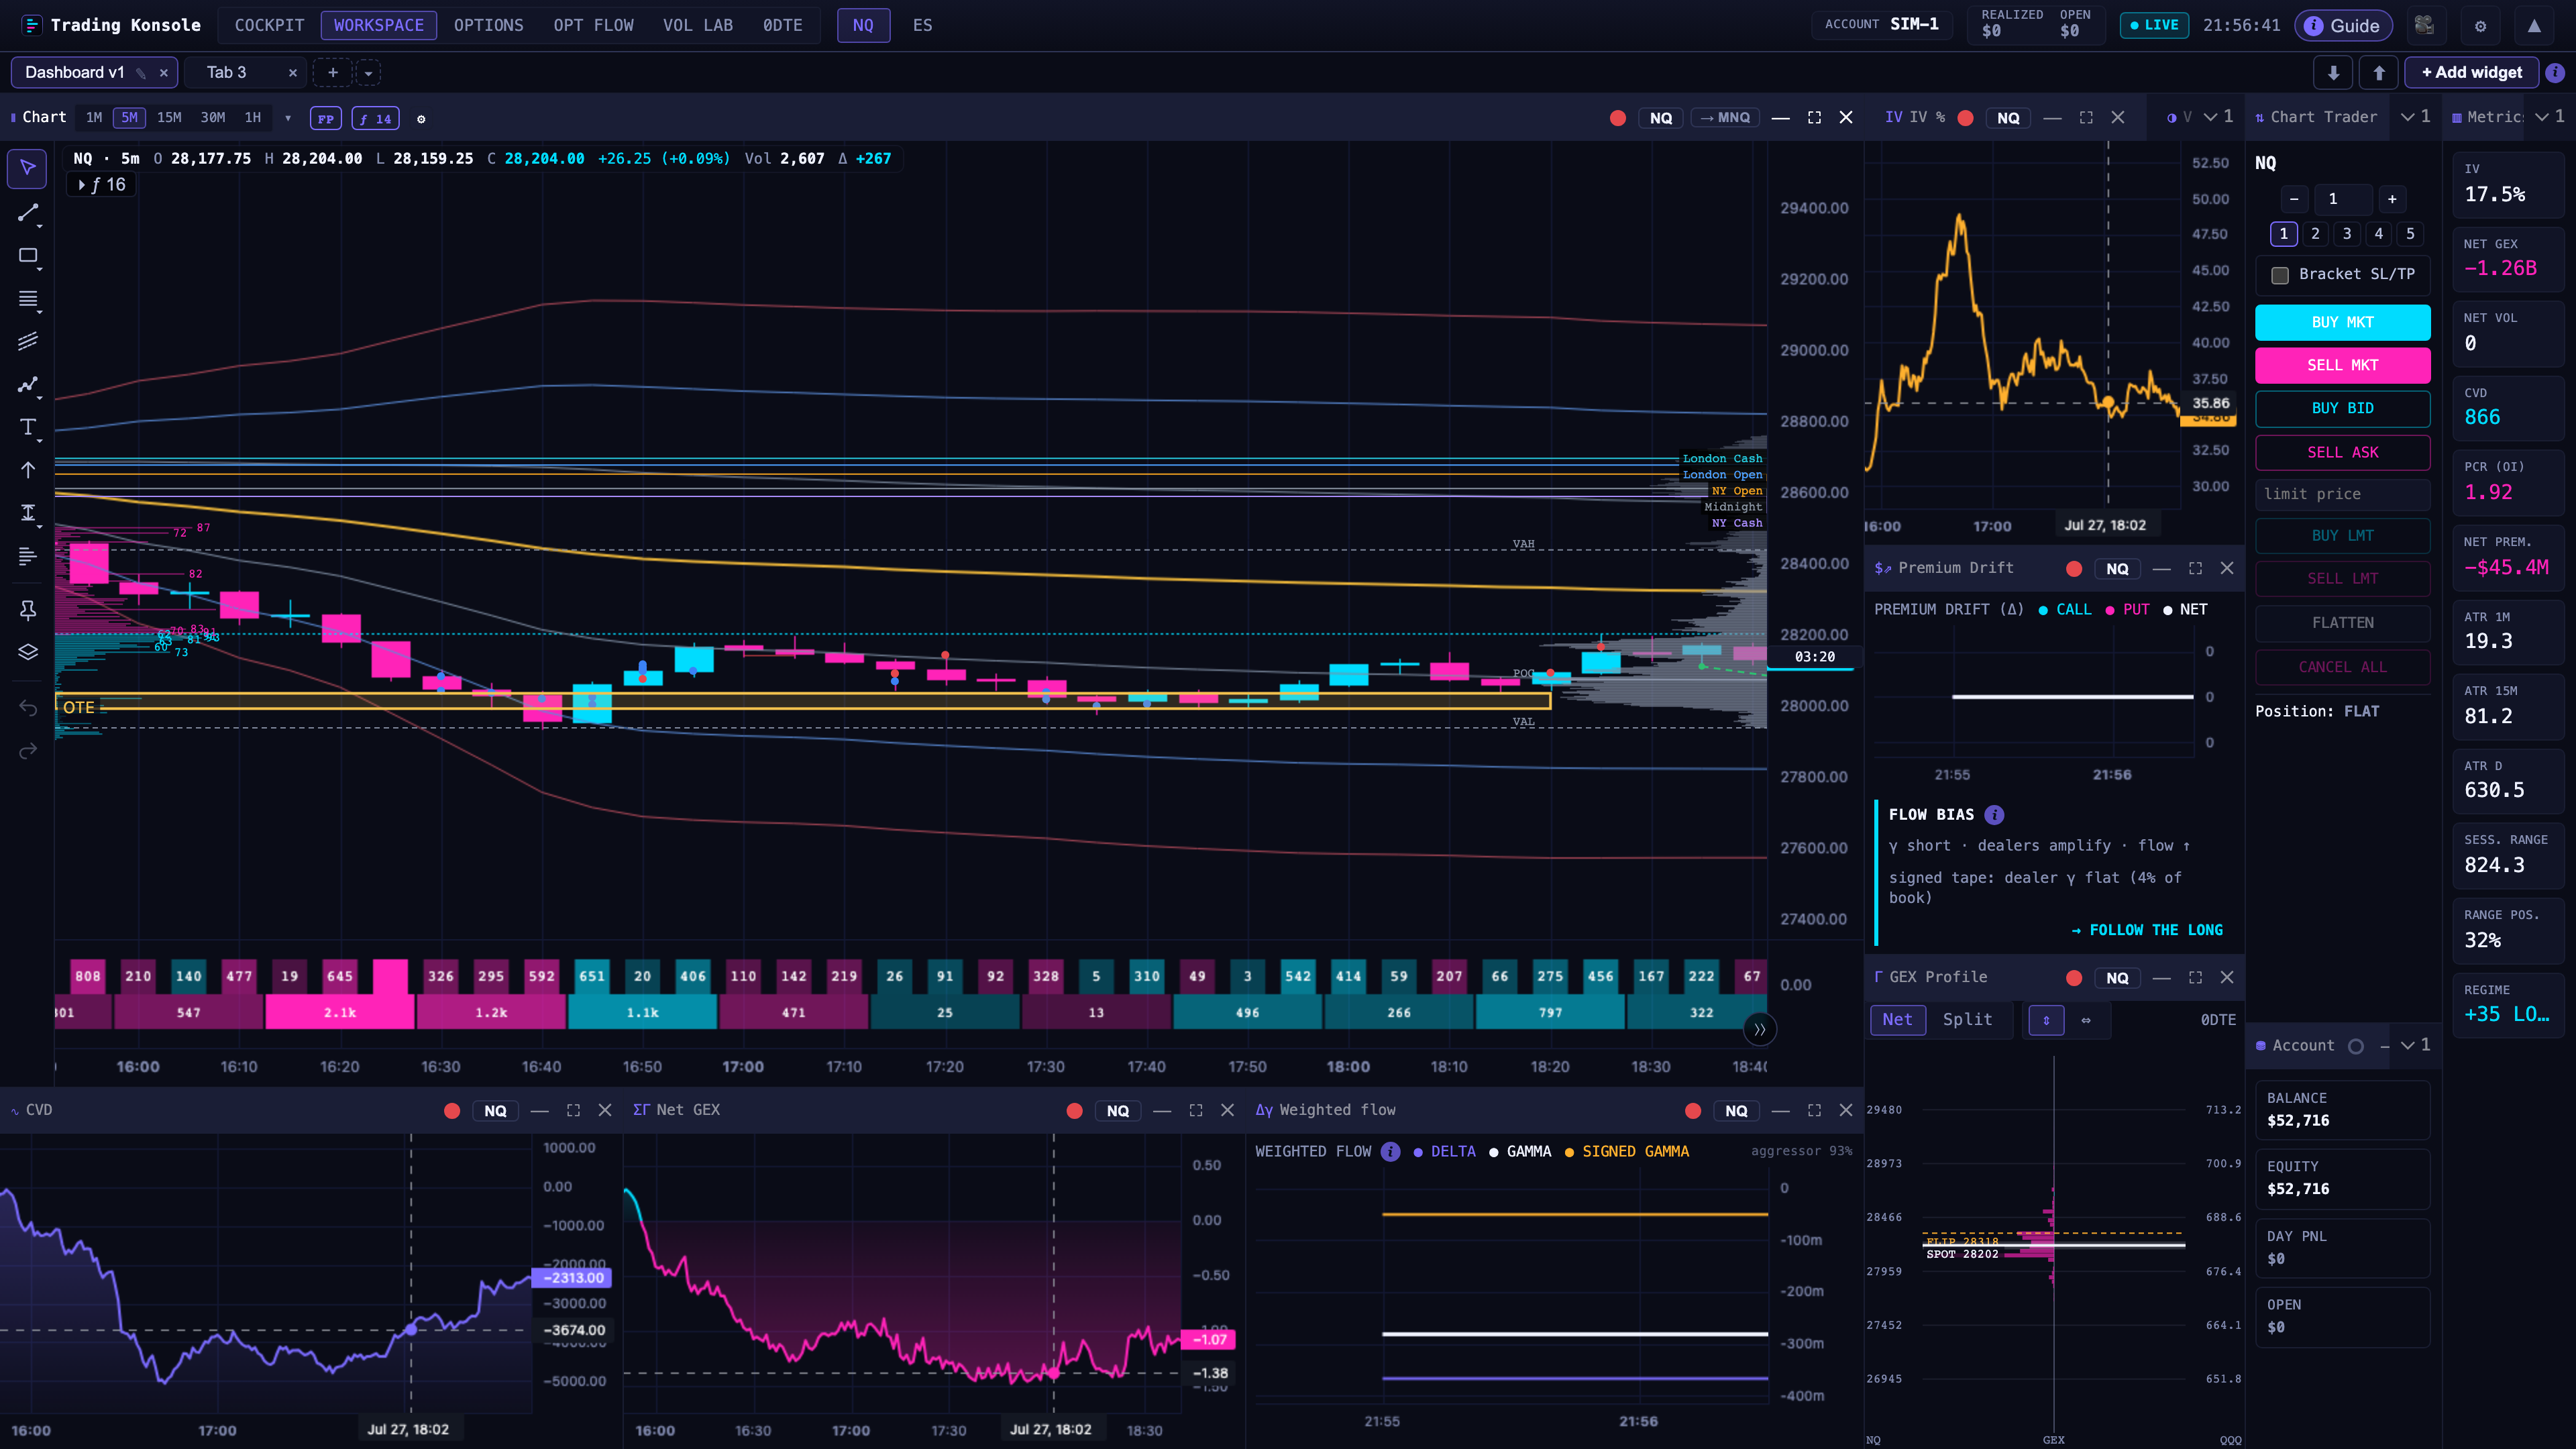
Order flow and footprint, 0DTE options, GEX and gamma flip, L2 liquidity and heatmap, multi-account trading, backtesting and ICT indicators, all on a single screen for intraday futures.
Order flow & footprint
The flow, read on the candle
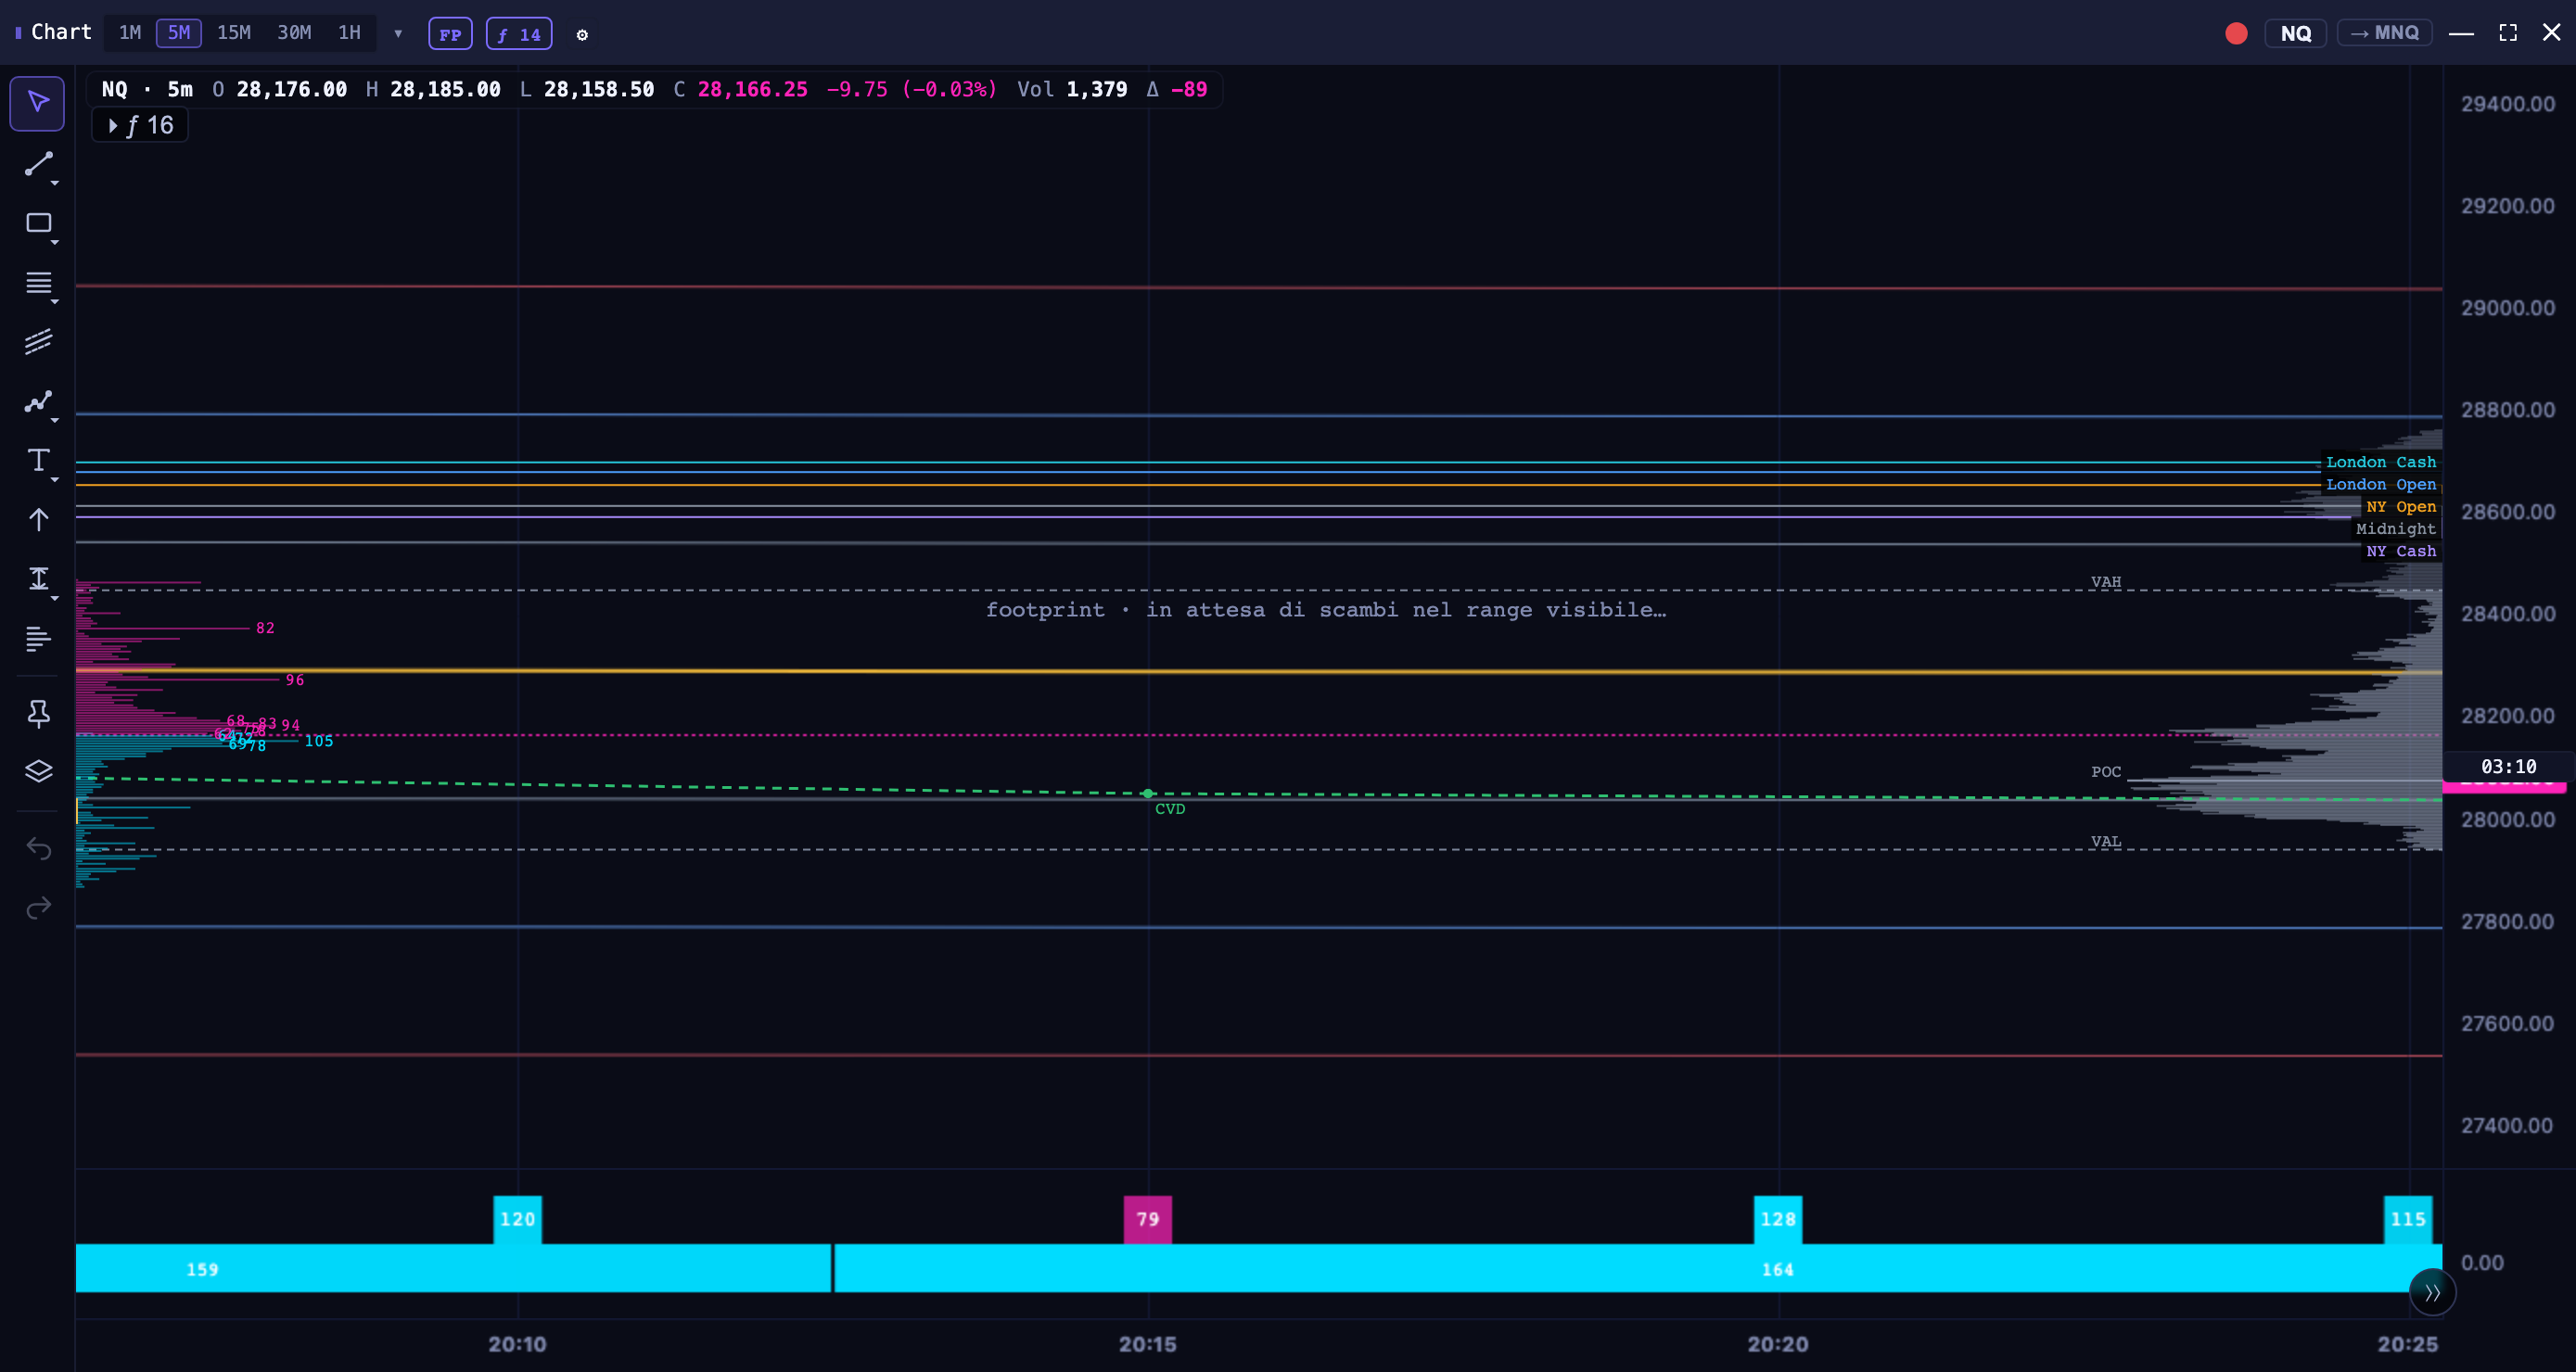
A volumetric footprint drawn beside every candle: volume executed at bid and ask for each price level, per-bar delta and highlighted imbalances. The session volume profile computes POC, HVN and the 70% value area (VAH/VAL). CVD and cumulative delta complete the read.
Footprint per level: Bid×Ask, Volume, Delta, Delta%, configurable cell
Diagonal/horizontal imbalances with threshold and minimum volume
POC, HVN and 70% Value Area (VAH/VAL) on session volume
CVD, delta and cumulative delta; per-bar statistics (delta max/min)
Automatic or manual row aggregation (ticks per row)
0DTE options
The options flow, in real time
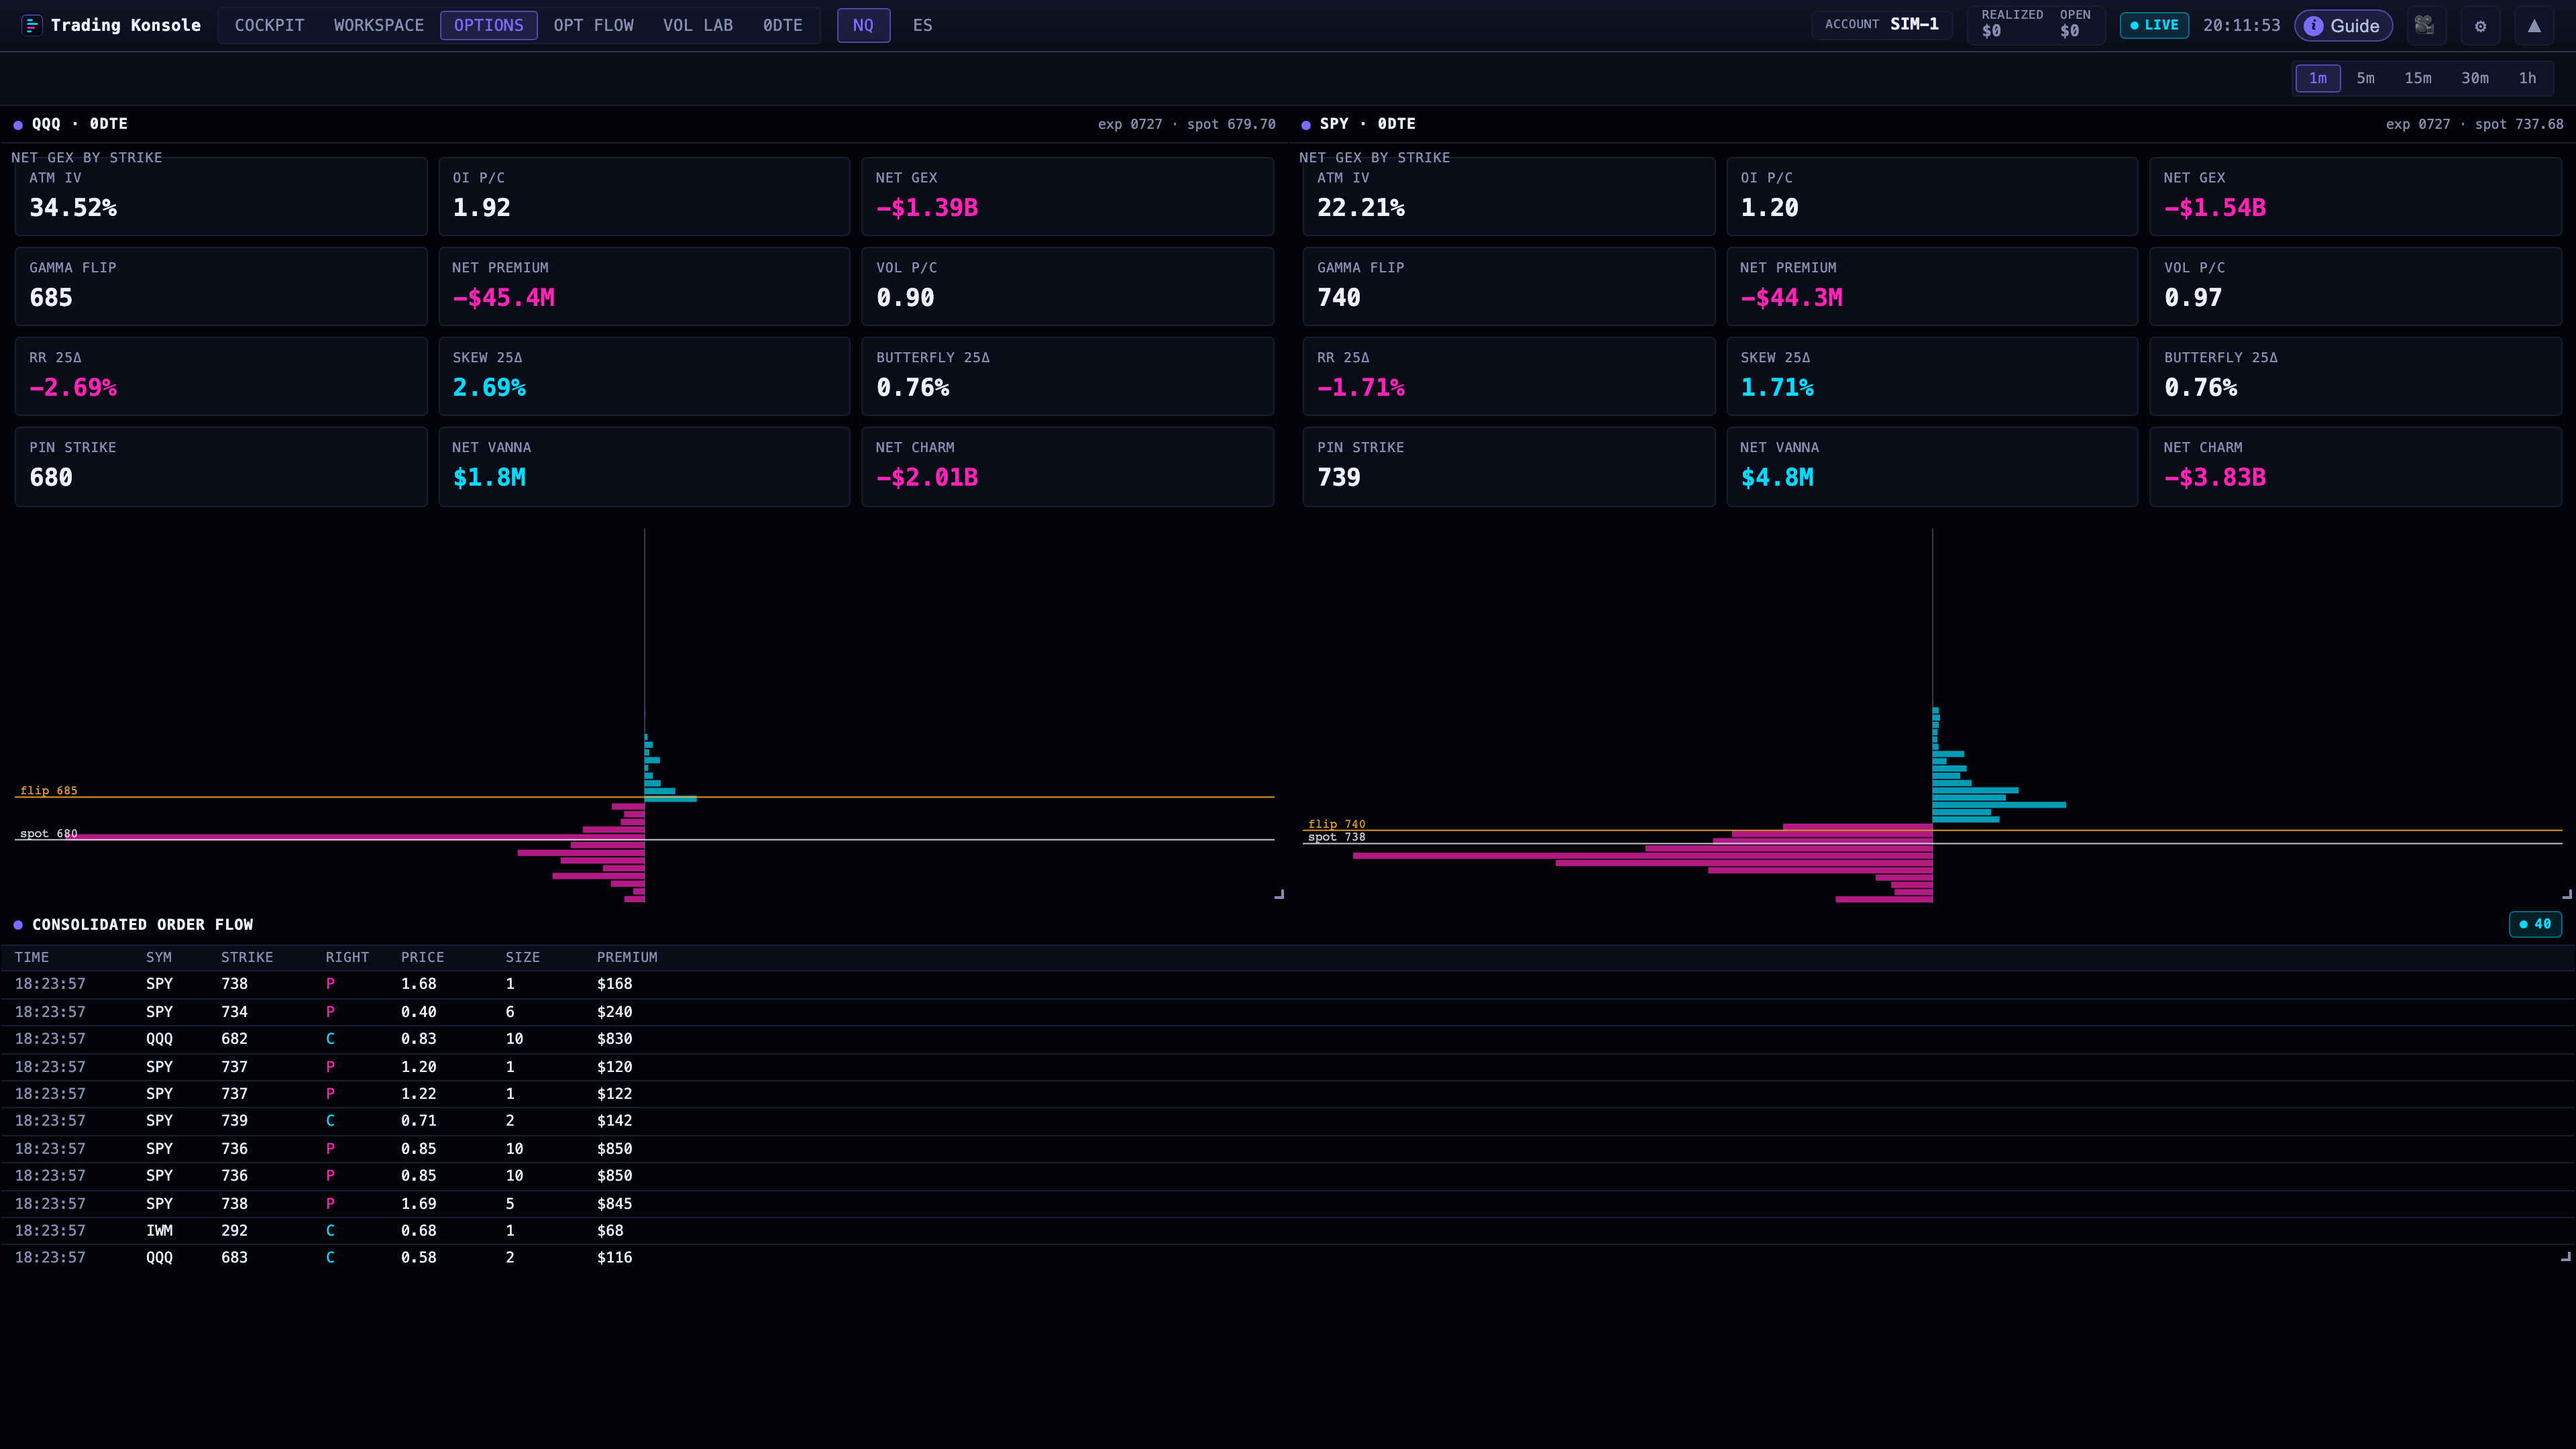
On QQQ and SPY 0DTE options, during US regular trading hours: call and put volume, put/call ratio and net premium as a positioning proxy. The daily-expiry chain updates greeks, open interest and volumes as the market moves.
0DTE chain on QQQ/SPY with greeks, open interest and volumes
Call/put volume and put/call ratio updated in real time
Net premium (call − put) as a positioning indicator
Options-flow tape for a close read
GEX & gamma flip
Gamma, brought onto the futures chart
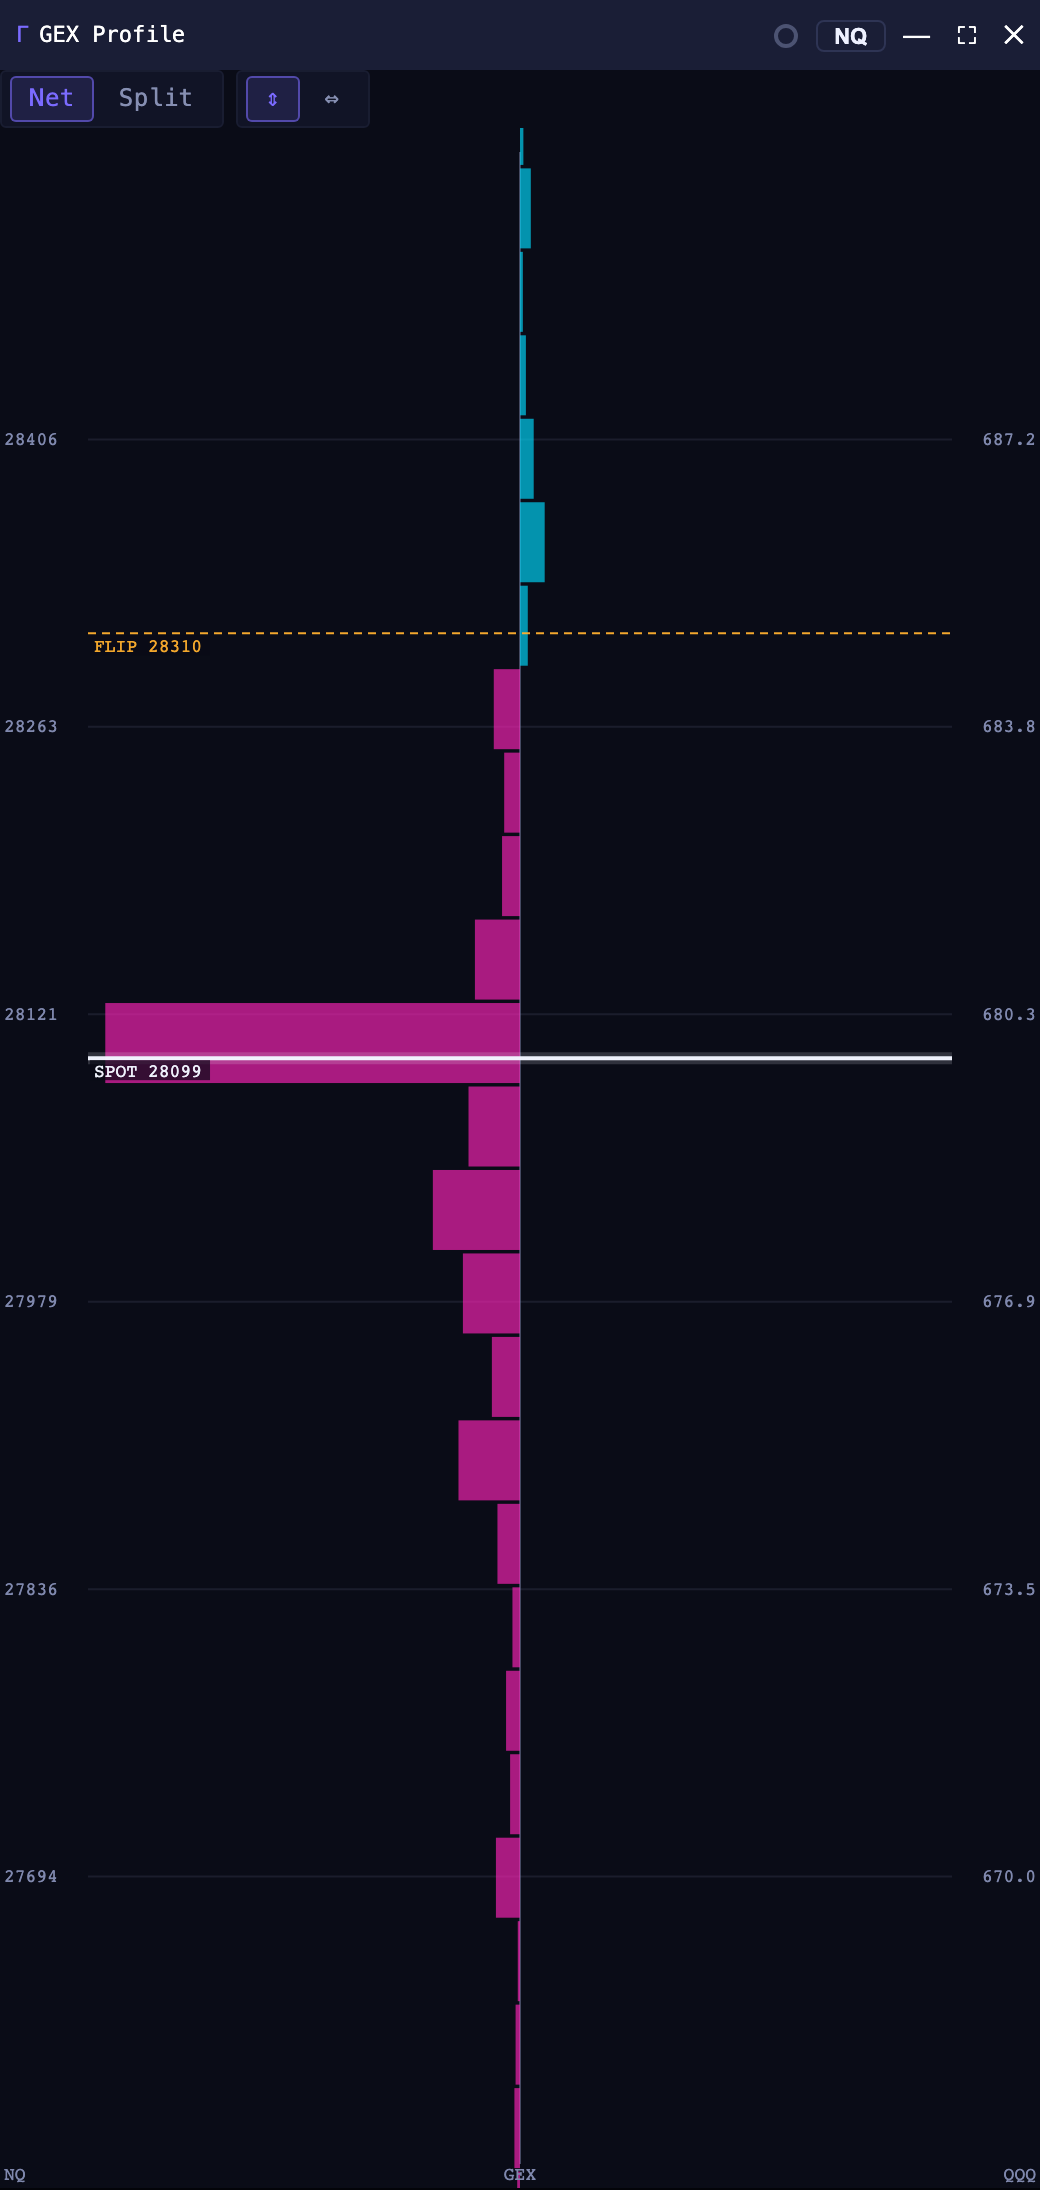
Gamma exposure (GEX) per strike, a spot-reactive gamma flip level and intraday net-GEX. Thanks to the NQ↔QQQ and ES↔SPY bridge, option levels are aligned onto the futures chart: the layer order-flow platforms usually do not put on the same screen.
GEX per strike with a vertical/horizontal profile on the chart
Gamma flip (zero-gamma) repriced against spot with Black-Scholes
Intraday net-GEX as a synced sub-chart
Futures to ETF bridge so option strikes land on the futures chart
Historical GEX reconstructed from ThetaData
Volatility & 0DTE Labs
Volatility labs
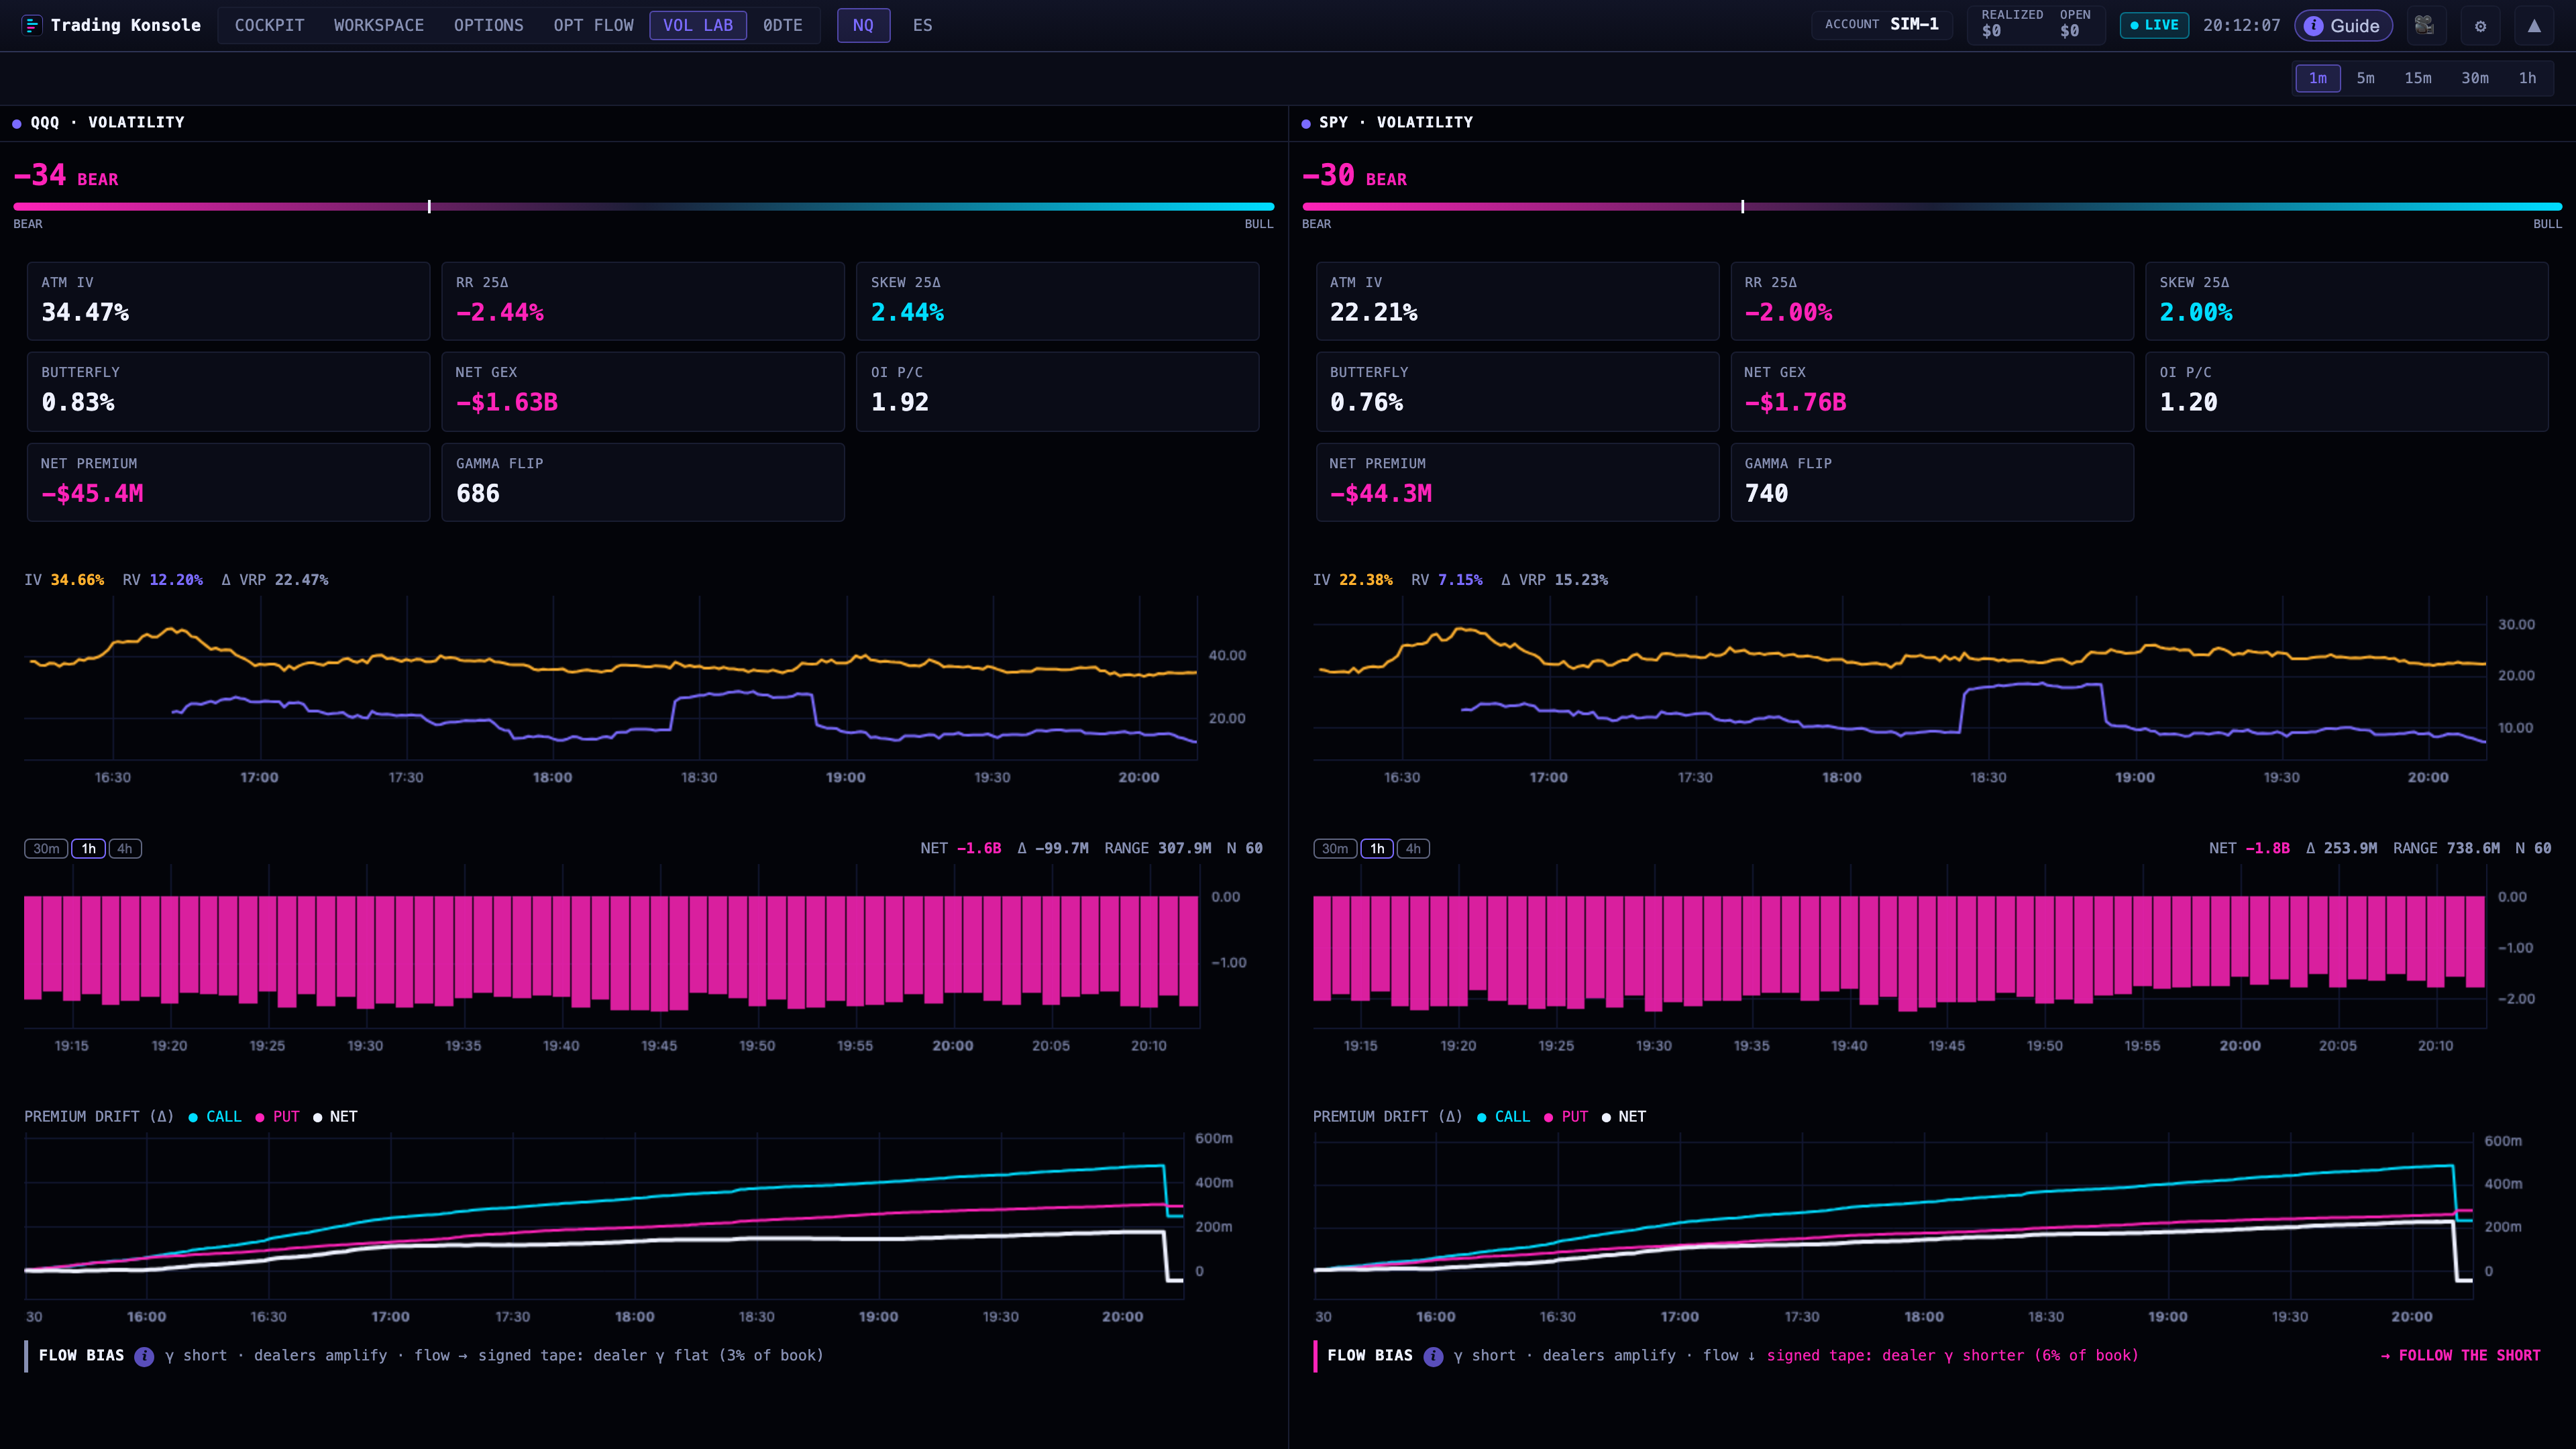
Panels dedicated to implied volatility and to studying 0DTE: IV metrics, time decay and sub-charts synced with the main chart. A workspace for reading the volatility context beside the flow.
IV and net-GEX sub-charts synced by crosshair and time scale
A view dedicated to studying the 0DTE chain
Volatility metrics beside order flow and GEX
Multi-account trading & risk
Trading futures on the real book
You trade futures: the CME index contracts and their micros, energy, metals. Multiple accounts with isolated PnL, click-to-trade from the DOM ladder, brackets with OCO and trailing, and full bracket recovery on restart. A per-account risk manager applies the daily-loss lockout and the risk rules before any order goes through. Real execution on your own Rithmic account, with simulation on the same live data when you need it.
Multiple accounts with isolated PnL and a trading journal
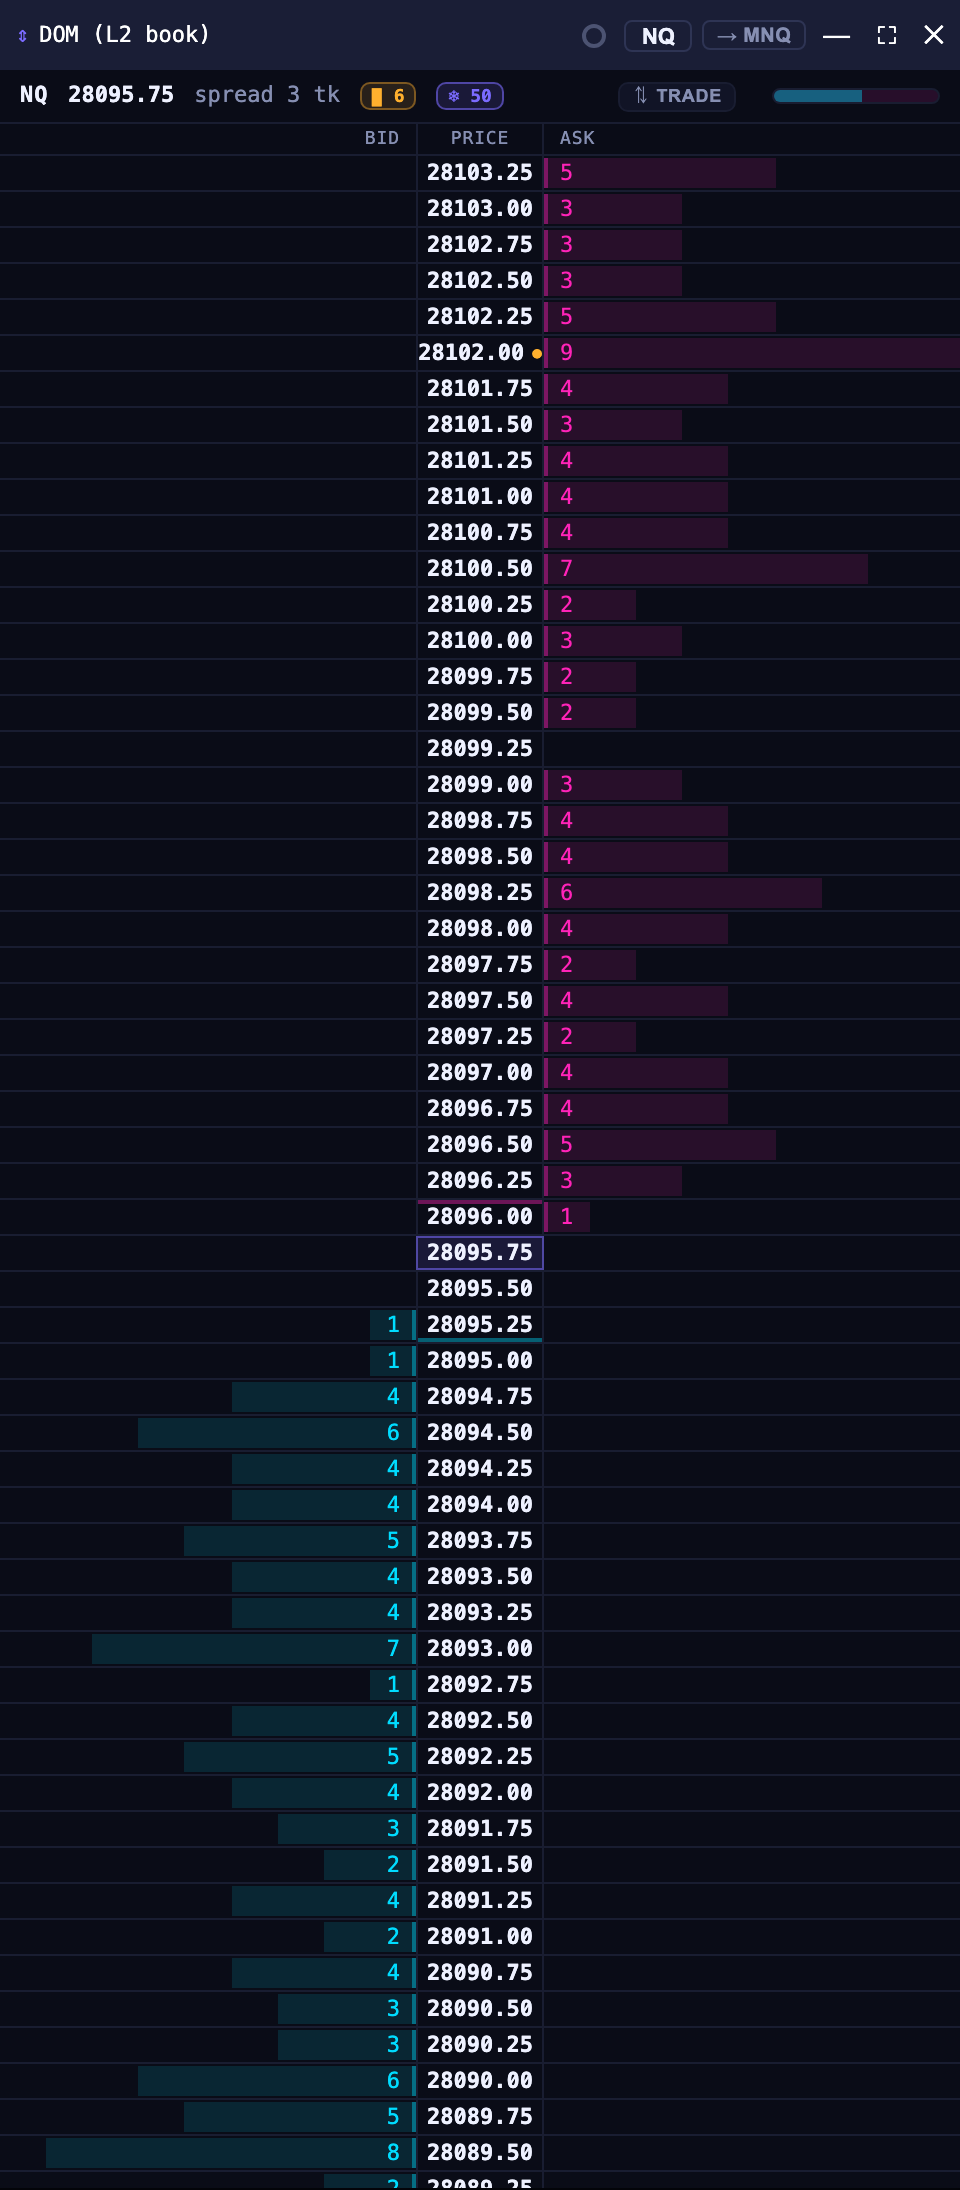
Click-to-trade from the DOM ladder with SL/TP brackets
OCO brackets, trailing and full recovery on restart
Per-account risk manager with a daily-loss lockout
Real execution on your own Rithmic account, simulation with no limits
Expert Advisor
Strategies without writing code
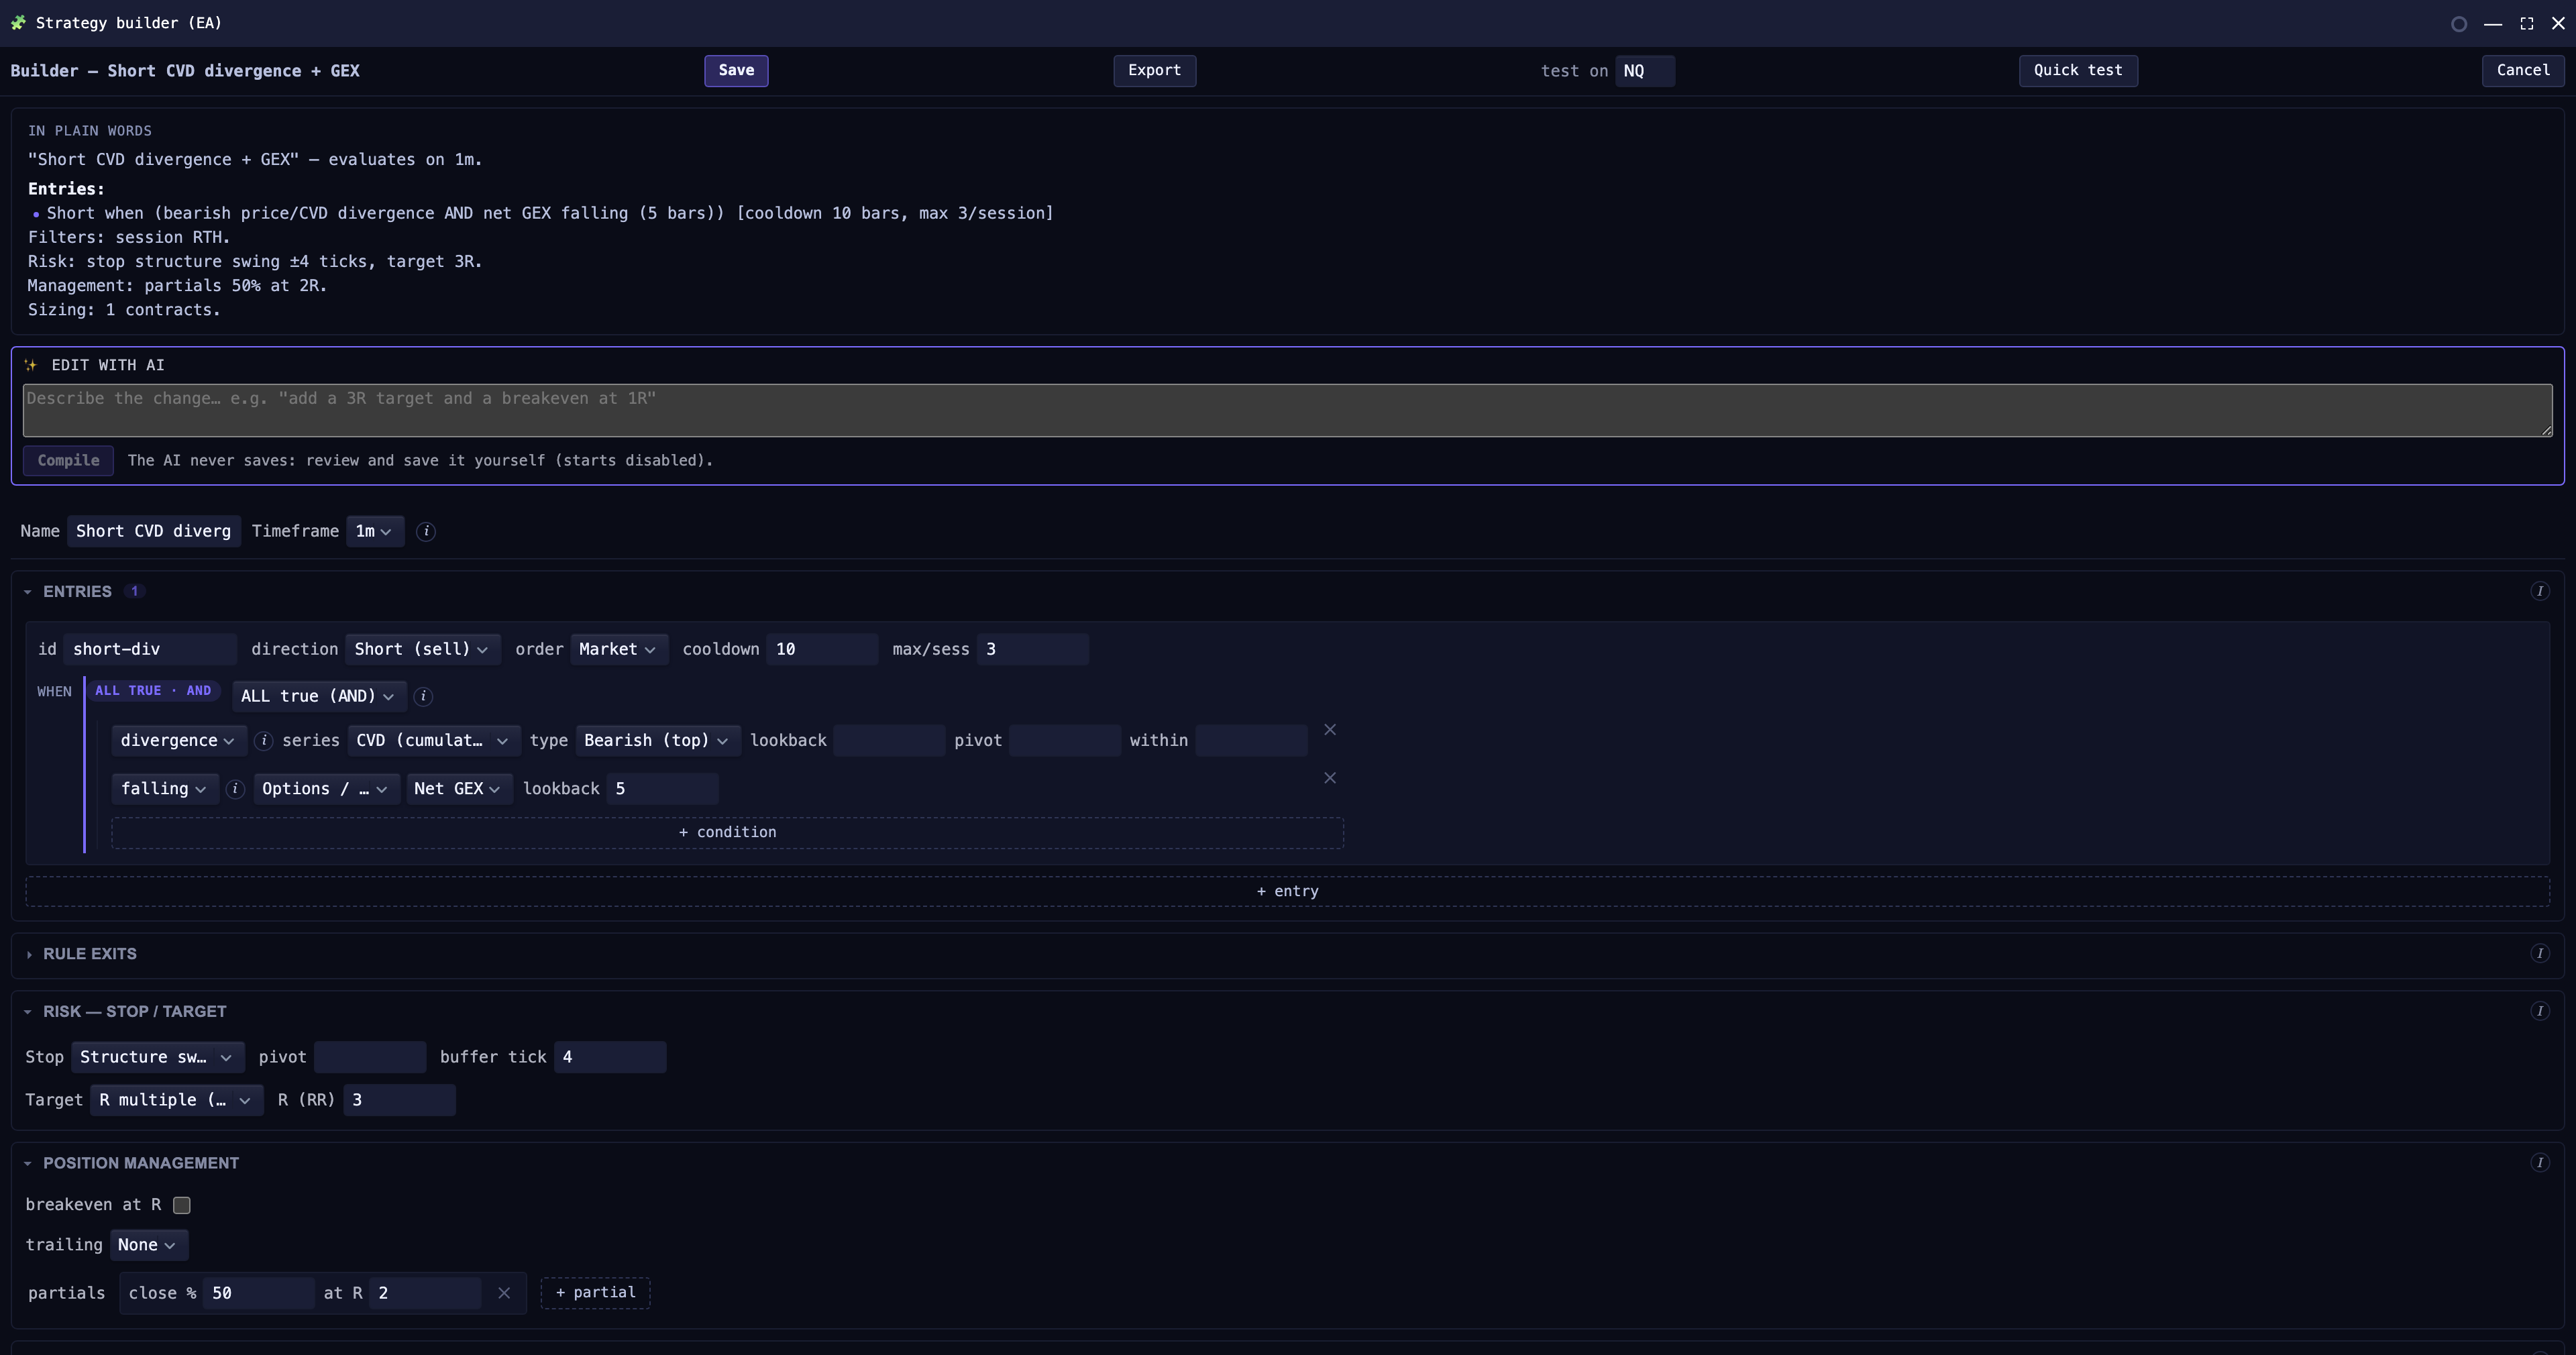
A visual block builder with a plain-language summary and ready-made templates. The same engine runs live, shadow and backtest, and every order still passes the risk gate. You can also describe a strategy in words and have the AI compile it.
Block builder with a plain-language summary
Ready-to-use strategy templates
The same engine in live, shadow and backtest
Orders always filtered by the risk gate
Workspace & skins
Compose your own desk
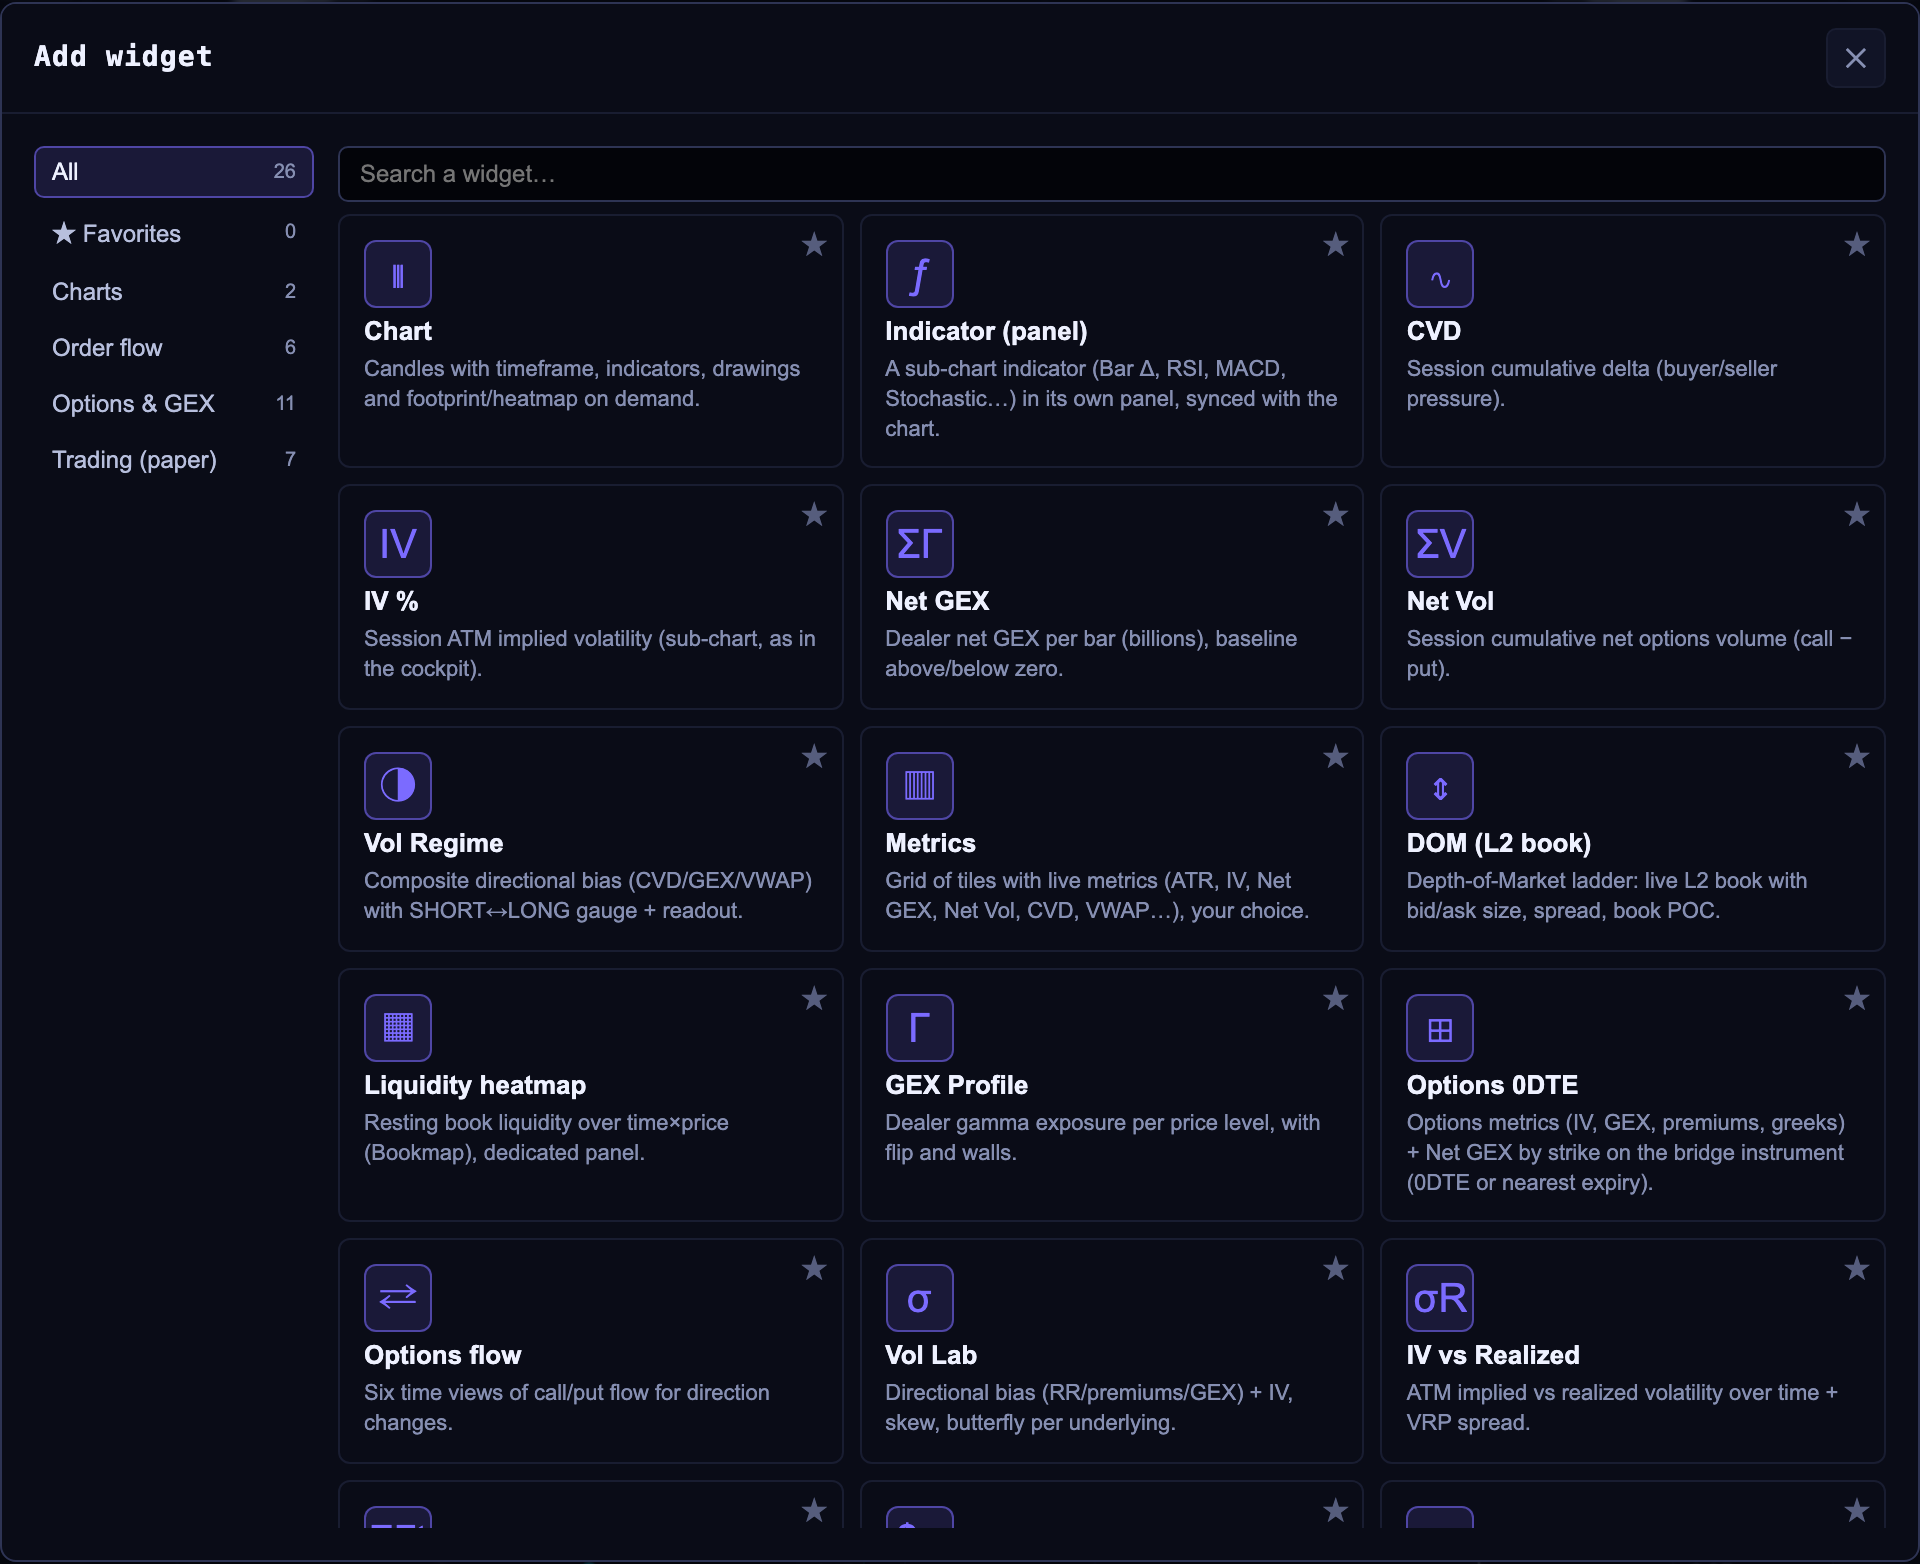
Dockable widgets and an indicator library: chart, order flow, options, GEX, DOM, heatmap, trading, journal, metrics. An instrument catalog to pick markets and contracts, and 13 selectable skins applied to both the interface and the canvas with a single switch.
Composable, dockable widgets, saved per tab
Indicator library and instrument catalog
13 skins (12 dark + 1 light) across interface and canvas
Multi-window support with widget tear-out
L2 liquidity & heatmap
See where the liquidity sits
The depth book, the Bookmap-style heatmap, liquidity walls and icebergs, all aligned to the futures chart.
L2 DOM ladder
Multi-level depth book with size at bid and ask, updated in real time.
Liquidity heatmap
Bookmap-style overlay on the chart and a dedicated panel with a progressive palette.
Liquidity walls
Detected server-side and shown as DOM annotations and lines on the heatmap.
Icebergs
Hidden orders (executed ≫ displayed) highlighted on the flow.
CVD & aggressor
Volume classified by aggressor side, with session cumulative delta.
Book recording
Sampled book and trades recorded for analysis (DuckDB/Parquet).
ICT indicators
Structure and levels, on the chart
A set of ICT indicators as chart overlays, with per-chart settings and per-timeframe visibility.
BOS / CHoCH
Break of structure and change of character on swings.
OTE
Fibonacci 62–79% band with a 70.5% sweet spot, editable.
Premium / Discount
Mid-range bands with a 50% line and 75/25 thresholds.
Order Blocks
Institutional order blocks marked on the chart.
HTF Candles
Higher-timeframe candles anchored to the right, count per TF.
Sessions & Killzone
Session levels (London/NY) and trading windows.
Fib Retracement
Retracements with a highlightable OTE zone and style templates.
Session Volume Profile
POC, HVN and value area on the session profile.
Backtest & historical data
Rewind and verify
Chart replay, a deterministic backtest engine and the reconstruction of historical GEX and options flow.
Chart replay
Rewind the session with a cursor over the loaded bars.
Deterministic engine
Reproducible backtest with no randomness: the same core as live and replay.
Historical GEX & flow
Reconstruction of GEX, greeks and OHLC from ThetaData, with the "historical GEX" modal.
Live recording
Ticks, book and option trades recorded to Parquet for later analysis.
Real trading. Multi-account trading runs on the real book through your own Rithmic account, and the same screen runs in simulation on live data whenever you want to rehearse.
Options data included. We serve the 0DTE options data for QQQ and SPY ourselves, during US market hours. Nothing else to subscribe to.
Markets. CME futures and their micros: indices, energy and metals. Option levels are bridged today from QQQ onto NQ and from SPY onto ES.